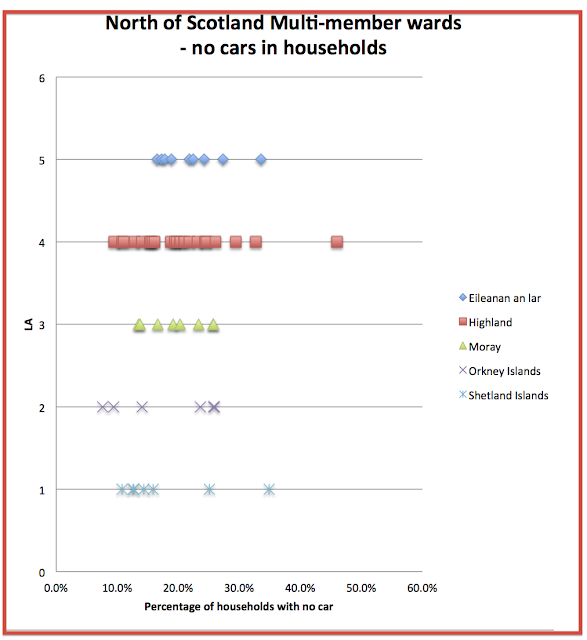
Scotland's Census statistics were released on car ownership for small areas on 14 Nov
http://www.scotlandscensus.gov.uk/en/censusresults/bulletinr2.html
The Scottish Government Urban Rural Classification provides a standard definition of rural areas in Scotland.
http://www.scotland.gov.uk/Topics/Statistics/About/Methodology/UrbanRuralClassification
The Scottish Index of Multiple Deprivation is produced by Scottish Government ,using statistics on income, employment, health, education, housing , access, crime to classify areas. (Low index= more deprived, High index= less deprived)
http://www.sns.gov.uk/Simd/Simd.aspx
Both these measures are produced for small areas (datazones) and can be combined with Census statistics to produce a profile of people living in these areas.
Not surprisingly the percentage of households with no car is highest in large urban areas at 40% of households. It is lowest in accessible rural areas at 14%. Accessible rural areas are also where there is the highest percentage of households with 2 or more cars.
There are clear relationships between areas of different levels of deprivation with declining percentages of households with no car as areas become less deprived. In the accessible rural and remote rural areas, the relationship is slightly different with similar levels of households with no car in the top three deciles.
The next installment will look at these variations in smaller areas within local authority area.
Notes
Urban Rural Classification
Scottish Index of Multiple Deprivation Deciles
1 - most deprived
.....
10 - least deprived
http://www.scotlandscensus.gov.uk/en/censusresults/bulletinr2.html
The Scottish Government Urban Rural Classification provides a standard definition of rural areas in Scotland.
http://www.scotland.gov.uk/Topics/Statistics/About/Methodology/UrbanRuralClassification
The Scottish Index of Multiple Deprivation is produced by Scottish Government ,using statistics on income, employment, health, education, housing , access, crime to classify areas. (Low index= more deprived, High index= less deprived)
http://www.sns.gov.uk/Simd/Simd.aspx
Both these measures are produced for small areas (datazones) and can be combined with Census statistics to produce a profile of people living in these areas.
Not surprisingly the percentage of households with no car is highest in large urban areas at 40% of households. It is lowest in accessible rural areas at 14%. Accessible rural areas are also where there is the highest percentage of households with 2 or more cars.
There are clear relationships between areas of different levels of deprivation with declining percentages of households with no car as areas become less deprived. In the accessible rural and remote rural areas, the relationship is slightly different with similar levels of households with no car in the top three deciles.
The next installment will look at these variations in smaller areas within local authority area.
Notes
Urban Rural Classification
1 Large Urban Areas | Settlements of over 125,000 people. |
2 Other Urban Areas | Settlements of 10,000 to 125,000 people. |
3 Accessible Small Towns | Settlements of between 3,000 and 10,000 people and within 30 minutes drive of a settlement of 10,000 or more. |
4 Remote Small Towns | Settlements of between 3,000 and 10,000 people and with a drive time of over 30 minutes to a settlement of 10,000 or more. |
5 Accessible Rural | Areas with a population of less than 3,000 people, and within a 30 minute drive time of a settlement of 10,000 or more. |
6 Remote Rural | Areas with a population of less than 3,000 people, and with a drive time of over 30 minutes to a settlement of 10,000 or more. |
Scottish Index of Multiple Deprivation Deciles
1 - most deprived
.....
10 - least deprived


