http://www.scotlandscensus.gov.uk/en/censusresults/bulletinr2.html
Discussion at a Spokes meeting on cycle investment mentioned levels of car ownership in areas.
http://www.spokes.org.uk/wordpress/2013/10/cycling-investment-spokes-autumn-public-meeting/
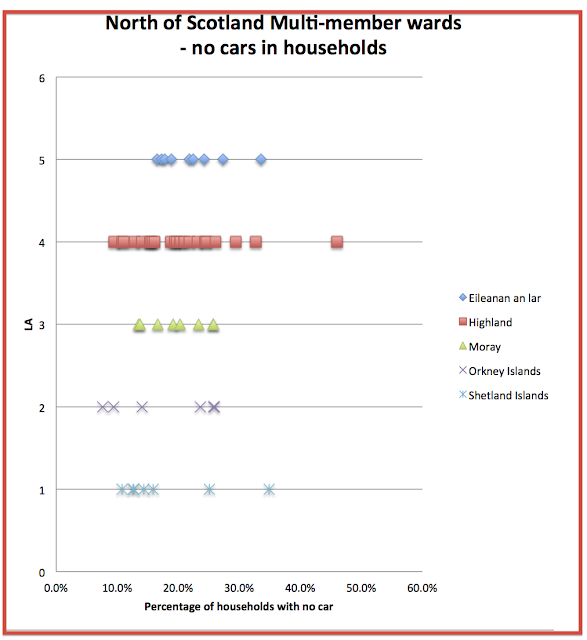
Charts illustrating the percentage of households with no car in multi-member wards in a number of council areas in Scotland follow. Show differences between neighbouring local authority areas.


Intriguing. Can you say a bit more about what how the charts can be interpreted? Looking at the main cities, is there an affluence factor? Or is it just that people in Edinburgh are lazier / less avtive than those in Glasgow?
ReplyDeleteNot sure what the vertical axes (LA) represent? Can you clarify?
Thanks!