Tuesday, 25 March 2014

Post Graduate Primary class - data handling and social subjects

This is the beginning of a post to provide some background data for students teachers to use in producing and interpreting charts with primary classes.

Here is a chart of household composition in Scotland with comparable figures for England,  Wales


Sources:
Census tables -
QS113SC,QS113EW

At a local level, the following gives the percentage of households in each electoral ward in Edinburgh.  This can be adapted for your own area.


What sorts of areas have the least one person households ?
And what about the areas with lots of one person households?


The chart below compares the percentage of single person households  in these areas, with the percentage of households in an area which are under 35 years(young households).


What does this suggest?

There are a couple of areas which are out of line, with the general trends. The class could investigate if there are any special features of these areas.
  • The Meadows ward seems to have an unusually high percentage of young households. 
  • The Southside ward has a relatively low percentage of young households.  
These statistics along with other characteristics which might be related to single person households are given in the table below

- the size of the house in terms of rooms
- a measure of underoccupancy (households with 2 or more rooms than required)


Data source here  http://bit.ly/1hmdykc


Tuesday, 18 March 2014

Census 2011 - more products on topic of ethnicity, language, religion and identity

Release 3B - Scottish Census 2011 tables 
- to be published 19th March

Details of all new tables planned
  - LC tables are produced for small areas including output areas and data zones


All the data contained in this release can be accessed through the Census Data Explorer on the Scotland’s Census website ( http://www.scotlandscensus.gov.uk  ).


Overview of Equality Results from the 2011 Census Release 2 
- to be published 21st March

The Scottish Government have analysed equality data from the 2011 Census Release 2 and will publish an overview paper drawing upon data from other already published sources.  It will focus primarily on ethnicity, religion and disability.


.

Sunday, 9 March 2014

SMC Conference session on using Census Data in Schools

I attended the Scottish Mathematical Council Conference in Stirling University on Saturday 8th March and ran a session to introduce maths teachers to Census data.  The session was a brief introduction to the Census process, but mostly a hands on session to use the Census Data Explorer

Seemed to go down well and discussions at the end point to creating an online guide to using the website - maybe a demo of the stages to interrogate the data and then creating charts using it.  Now off to explore free software tools to do this. Slides available on Past Conference Presentations section of the SMC conference website  http://bit.ly/MZfoK6

Stages of the workshop

1) Area profiles - compare characteristics of two areas with Scotland

Comparison of responses to identity question in
Scottish Parliamentary Constituencies of Falkirk East and Linlithgow


2) Standard Maps 
 Screen shot of percentage of local authority responding Scottish Identity only
[Apologies Shetland seems to be off the map]


3) Standard Charts
Screen shot of chart of percentage reporting Scottish Identity only - sorted by council from Edinburgh City to West Dunbartonshire


4) Standard Outputs
Screen shot of method of selecting areas using map function


5) Downloaded tables of national identity by religion


Friday, 28 February 2014

Census 2011 - more details on topic of ethnicity, language, religion and identity

Scottish Census 2011 tables published on 27 February

http://www.scotlandscensus.gov.uk/news/census-2011-detailed-characteristics-ethnicity-identity-language-and-religion-scotland-–

This release includes a number of tables which gives the age/sex distribution of population groups.  This means that you can produce population pyramids.Population pyramids for a few of the larger ethnic group categories.

Further analysis will be added to look at how the profiles have changed since 2001.  May be slightly tricky given the question on ethnicity changed.


White: Scottish


White: Other British


  White: Polish


White: Other White


Asian


Details of all new tables

Table Number Table name
DC1117SC Age by sex
DC2101SC Ethnic group by sex by age
DC2102SC National identity by sex by age
DC2105SC Proficiency in English by sex by age
DC2107SC Religion by sex by age
DC2121SC Scots language skills by sex by age
DC2201SC Ethnic group by religion
DC2202SC National identity by ethnic group 
DC2204SC National identity by religion
DC2205SC Country of birth by ethnic group 

All the data contained in this release can be accessed through the Census Data Explorer on the Scotland’s Census website ( http://www.scotlandscensus.gov.uk  ).


Acknowledgement: The population pyramids were created using the tool used by National Records for Scotland to show the changing population profiles over time.  


Sunday, 23 February 2014

England and Wales Census 2011 - tables on ethnicity and age

Next set of Scottish Census 2011 tables due on 27 February - more tables from the Ethnicity, Identity, Language and Religion topics. Outputs Prospectus


Table Number Table name
DC1117SC Age by sex
DC2101SC Ethnic group by sex by age
DC2102SC National identity by sex by age
DC2105SC Proficiency in English by sex by age
DC2107SC Religion by sex by age
DC2121SC Scots language skills by sex by age
DC2201SC Ethnic group by religion
DC2202SC National identity by ethnic group 
DC2204SC National identity by religion
DC2205SC Country of birth by ethnic group 

Here are some results based on the England and Wales tables of Ethnic group by sex by age (DC2010EW) which were published last year.  When the Scottish data are published, results for Scotland will be published alongside these.

The different population groups exhibit very different age/sex patterns.
  • The White:Irish population is predominantly older people.  
  • The mixed ethnicity population are predominantly younger, presumably children of parents of different ethnic groups

The Economic and Social Research Council's Centre on Dynamics of Ethnicity (CoDE) has prepared briefing documents on the 'Dynamics of diversity: evidence from the 2011 Census' based on the data from England and Wales.  This explores the different characteristics of ethnic populations and also explore the drivers of changes.
http://www.ethnicity.ac.uk/census/


England and Wales Census 2011 Population Pyramids for a range of ethnic groups
- Males (Blue), Females (Red), Vertical Axis (Age groups)


White: English/Scottish/Welsh/Northern Irish/British


White:Irish


White: Gypsy Traveller


 White: Other White


Mixed Ethnic Groups

Asian/Asian British


Black/African/Caribbean/Black British


Acknowledgement: The population pyramids were created using the tool used by National Records for Scotland to show the changing population profiles over time.  http://www.gro-scotland.gov.uk/statistics/theme/population/projections/scotland/population-pyramids.html

Monday, 27 January 2014

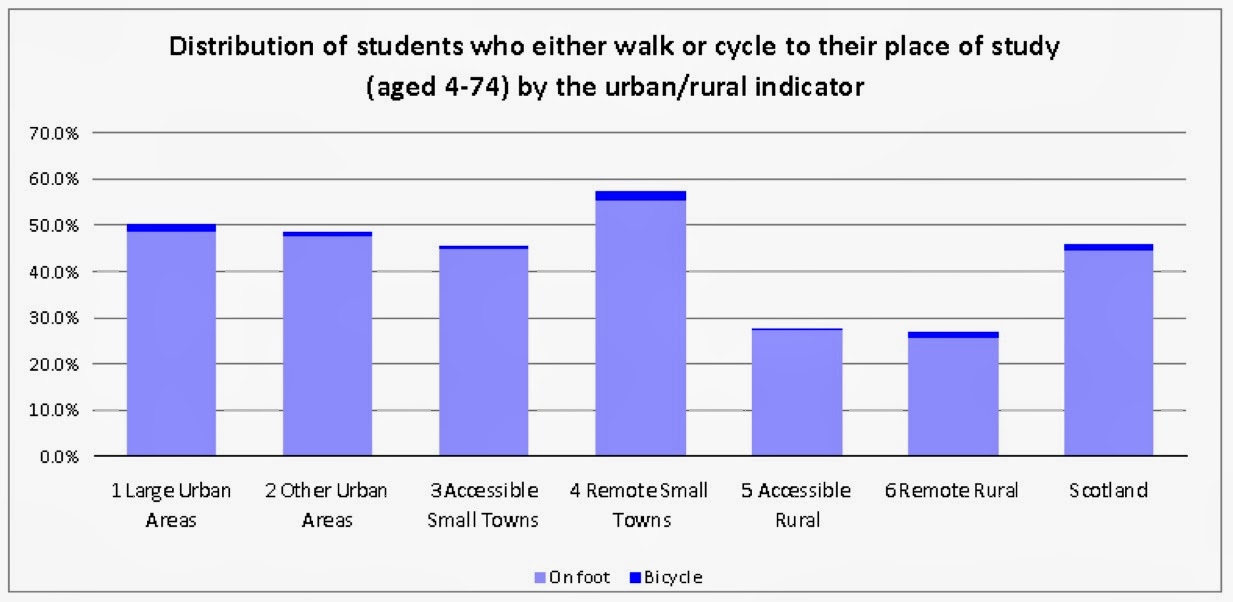
Census 2011 Travel to work or study - overview of results


Here are a few extracts from a presentation used in the AQMEN workshop last week.

Census 2011 - Analysis of mode of transport 
Daniela Ene, National Records of Scotland
 Census question


Travel to work by local authority
Change since 2001
  
Travel to work by Scottish Index of Multiple Deprivation


Travel to work by urban rural classification


Travel to study by local authority


 Travel to study by Scottish Index of Multiple Deprivation

Travel to work by urban rural classification


Sources of data
Mode of transport for economically active people aged 16-74, excluding full time students (see table QS701SC – Method of travel to work- on the website: http://www.scotlandscensus.gov.uk/ods-web/standard-outputs.html )
To identify the number of students subtract from table QS702SC –method of travel to work or study- the table QS701SC
For datazone analysis, data can be downloaded from the ‘Data Warehouse’ section on the website above.
For looking up the profile of a datazone see the Scottish Neighbourhood Statistics website:
       http://www.sns.gov.uk

Saturday, 25 January 2014

Fife wards - Census statistics on method of travel to work and study

Method of travel to study  


Percentage of students(including school pupils) travelling by bike in Fife wards 


Method of travel to work  


Percentage travelling to work by bike in Fife wards 

Datasets available here http://bit.ly/1l9GFJD