Friday, 28 February 2014

Census 2011 - more details on topic of ethnicity, language, religion and identity

Scottish Census 2011 tables published on 27 February

http://www.scotlandscensus.gov.uk/news/census-2011-detailed-characteristics-ethnicity-identity-language-and-religion-scotland-–

This release includes a number of tables which gives the age/sex distribution of population groups.  This means that you can produce population pyramids.Population pyramids for a few of the larger ethnic group categories.

Further analysis will be added to look at how the profiles have changed since 2001.  May be slightly tricky given the question on ethnicity changed.


White: Scottish


White: Other British


  White: Polish


White: Other White


Asian


Details of all new tables

Table Number Table name
DC1117SC Age by sex
DC2101SC Ethnic group by sex by age
DC2102SC National identity by sex by age
DC2105SC Proficiency in English by sex by age
DC2107SC Religion by sex by age
DC2121SC Scots language skills by sex by age
DC2201SC Ethnic group by religion
DC2202SC National identity by ethnic group 
DC2204SC National identity by religion
DC2205SC Country of birth by ethnic group 

All the data contained in this release can be accessed through the Census Data Explorer on the Scotland’s Census website ( http://www.scotlandscensus.gov.uk  ).


Acknowledgement: The population pyramids were created using the tool used by National Records for Scotland to show the changing population profiles over time.  


Sunday, 23 February 2014

England and Wales Census 2011 - tables on ethnicity and age

Next set of Scottish Census 2011 tables due on 27 February - more tables from the Ethnicity, Identity, Language and Religion topics. Outputs Prospectus


Table Number Table name
DC1117SC Age by sex
DC2101SC Ethnic group by sex by age
DC2102SC National identity by sex by age
DC2105SC Proficiency in English by sex by age
DC2107SC Religion by sex by age
DC2121SC Scots language skills by sex by age
DC2201SC Ethnic group by religion
DC2202SC National identity by ethnic group 
DC2204SC National identity by religion
DC2205SC Country of birth by ethnic group 

Here are some results based on the England and Wales tables of Ethnic group by sex by age (DC2010EW) which were published last year.  When the Scottish data are published, results for Scotland will be published alongside these.

The different population groups exhibit very different age/sex patterns.
  • The White:Irish population is predominantly older people.  
  • The mixed ethnicity population are predominantly younger, presumably children of parents of different ethnic groups

The Economic and Social Research Council's Centre on Dynamics of Ethnicity (CoDE) has prepared briefing documents on the 'Dynamics of diversity: evidence from the 2011 Census' based on the data from England and Wales.  This explores the different characteristics of ethnic populations and also explore the drivers of changes.
http://www.ethnicity.ac.uk/census/


England and Wales Census 2011 Population Pyramids for a range of ethnic groups
- Males (Blue), Females (Red), Vertical Axis (Age groups)


White: English/Scottish/Welsh/Northern Irish/British


White:Irish


White: Gypsy Traveller


 White: Other White


Mixed Ethnic Groups

Asian/Asian British


Black/African/Caribbean/Black British


Acknowledgement: The population pyramids were created using the tool used by National Records for Scotland to show the changing population profiles over time.  http://www.gro-scotland.gov.uk/statistics/theme/population/projections/scotland/population-pyramids.html

Monday, 27 January 2014

Census 2011 Travel to work or study - overview of results


Here are a few extracts from a presentation used in the AQMEN workshop last week.

Census 2011 - Analysis of mode of transport 
Daniela Ene, National Records of Scotland
 Census question


Travel to work by local authority
Change since 2001
  
Travel to work by Scottish Index of Multiple Deprivation


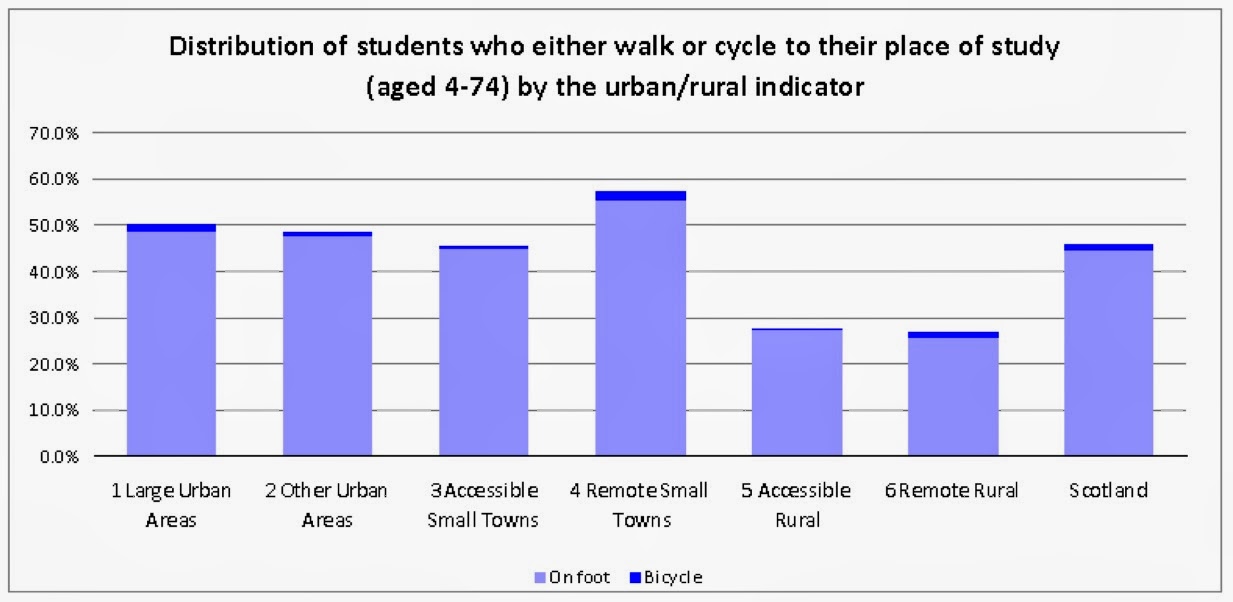
Travel to work by urban rural classification


Travel to study by local authority


 Travel to study by Scottish Index of Multiple Deprivation

Travel to work by urban rural classification


Sources of data
Mode of transport for economically active people aged 16-74, excluding full time students (see table QS701SC – Method of travel to work- on the website: http://www.scotlandscensus.gov.uk/ods-web/standard-outputs.html )
To identify the number of students subtract from table QS702SC –method of travel to work or study- the table QS701SC
For datazone analysis, data can be downloaded from the ‘Data Warehouse’ section on the website above.
For looking up the profile of a datazone see the Scottish Neighbourhood Statistics website:
       http://www.sns.gov.uk

Saturday, 25 January 2014

Fife wards - Census statistics on method of travel to work and study

Method of travel to study  


Percentage of students(including school pupils) travelling by bike in Fife wards 


Method of travel to work  


Percentage travelling to work by bike in Fife wards 

Datasets available here http://bit.ly/1l9GFJD


Wednesday, 15 January 2014

Example of deprivation analysis using Census 2011 datazone tables

Tables of census statistics published for datazones can be aggregated using the deprivation category assigned to each area.

Tables on ethnicity were aggregated in this way, aggregated data here and background data  here

Charts of the percentage of ethnic groups within each deprivation category are provided below for three groups - White:Polish, African and Indian.  These groups show different patterns
- people reporting a White Polish ethnicity make up a larger proportion of the population in the more deprived areas at around 10% , reducing to 2% of the least deprived areas.
- this is also the case with people reporting African ethnicity with around 16% of the people in the most deprived areas
- the people in the most deprived areas are less likely to report  Indian ethnic group (at 4%) compared with around 8% in the least deprived areas.


Scotland's Census statistics on ethnic group available from Census Data Explorer - table KS201SC http://www.scotlandscensus.gov.uk/ods-web/standard-outputs.html

The Scottish Index of Multiple Deprivation is produced by Scottish Government ,using statistics on income, employment, health, education, housing , access, crime to classify areas.  (Low index= more deprived, High index= less deprived)
http://www.sns.gov.uk/Simd/Simd.aspx

Thursday, 19 December 2013

Glasgow wards - Census statistics on method of travel to work and study

Method of travel to study 


Percentage of students(including school pupils) travelling by bike in Glasgow multi-member wards


Method of travel to work 


Percentage travelling to work by bike              

Glasgow multi-member wards 


Datasets available here http://bit.ly/1dPrrDM


Edinburgh wards - Census statistics on method of travel to work and study


Scotland's Census statistics were released today on method of travel to work or study
http://www.scotlandscensus.gov.uk/en/censusresults/bulletinr2.html

Some results for Edinburgh as a starter.

Method of travel to study  


Percentage of students(including school pupils) travelling by bike              

Edinburgh multi-member wards


Method of travel to work


Percentage travelling to work by bike              

Edinburgh multi-member wards


References

Census tables

QS701SC – Method of travel to work – resident population
QS702SC – Method of travel to work or study – resident population

Link to Census Data Explorer to download tables
http://www.scotlandscensus.gov.uk/ods-web/home.html


Link to metadata on travel to work or study question
http://www.scotlandscensus.gov.uk/ods-web/metadata.html?metadatavar=transportps11